What do different measures say about the trajectory (rather than level) of employment?
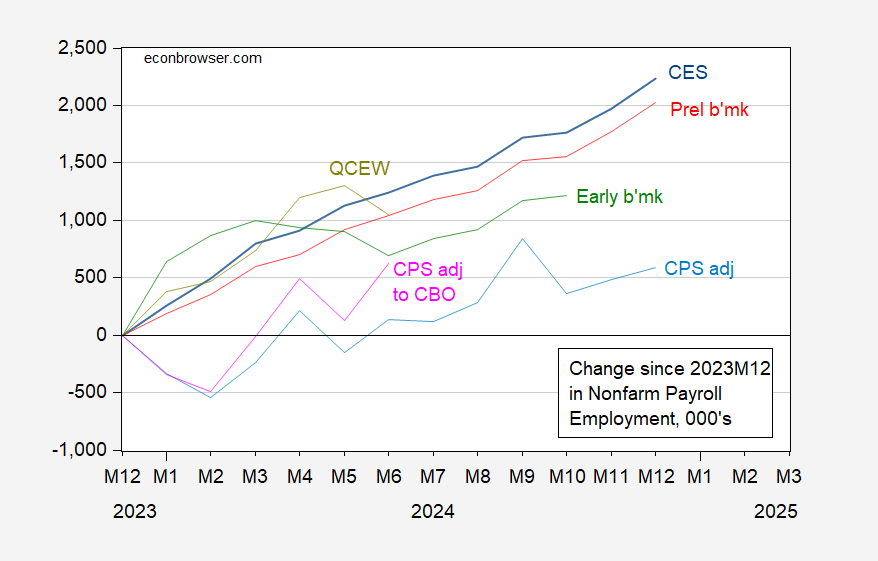
For non-farm payroll employment:

Figure 1: Change since 2023M12 in nonfarm payroll employment from CES (blue), implied from preliminary benchmark (red), implied from Philadelphia Fed early benchmark (green), CPS adjusted to nonfarm payroll concept (blue), CPS adjusted to nonfarm payroll concept, adjusted to incorporate CBO estimates of immigration (pink), QCEW total covered employment seasonally adjusted by author using X-13 (chartreuse), all in 000’s. Source: BLS via FRED, BLS, Philadelphia Fed, and author’s calculations.
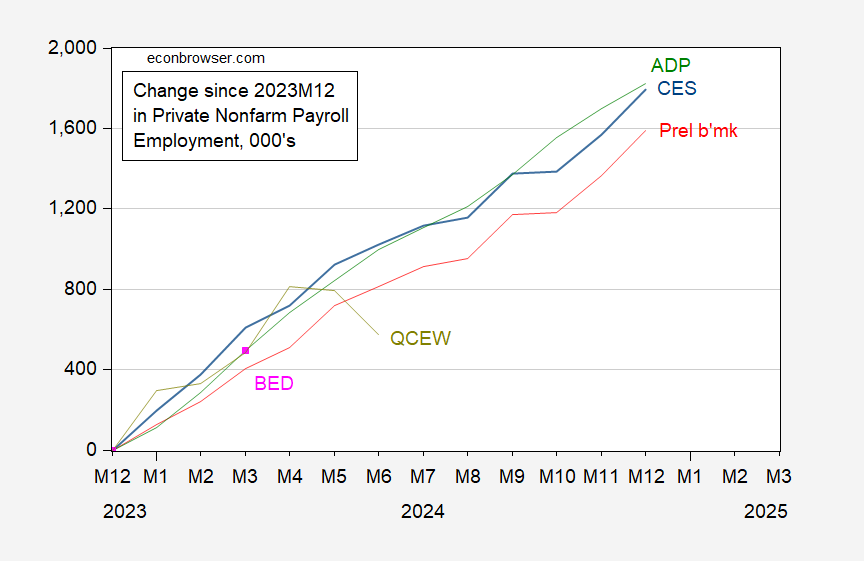
For private non-farm payroll employment:

Figure 1: Change since 2023M12 in private nonfarm payroll employment from CES (blue), implied from preliminary benchmark (red), from ADP-Stanford Digital Economy Laboratory (green), from Business Employment Dynamics (pink square), QCEW total covered employment seasonally adjusted by author using X-13 (chartreuse), all in 000’s. Source: BLS via FRED, BLS, Philadelphia Fed, and author’s calculations.

