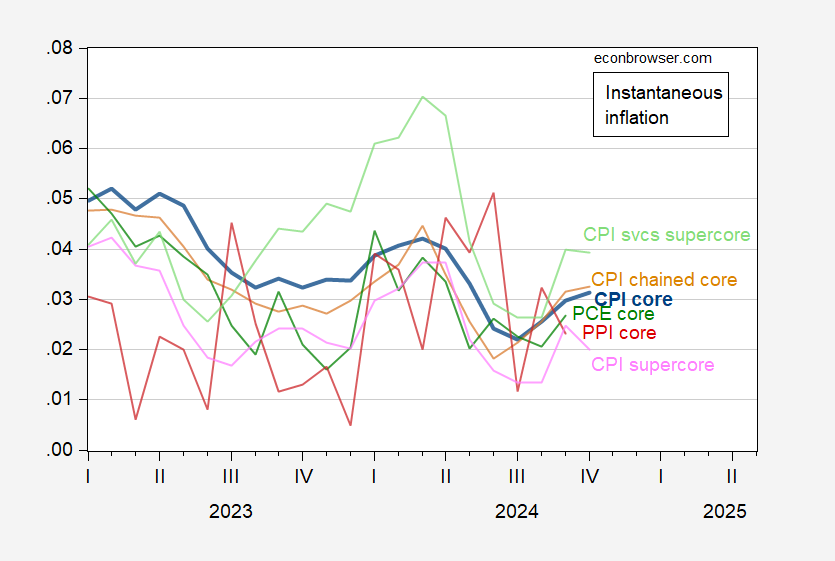
Core up, but supercore down:

Figure 1: Instantaneous inflation for core CPI (blue), chained core CPI (tan), supercore CPI (pink), services supercore (light green), PPI core (red), and PCE core (green), per Eeckhout (2023), T= 12, a=4. Source: BLS, BEA, Pawel Skrzypczynski, and author’s calculations.

