

bee Calculated Risk On 2/16/2025 09:09:00 AM
What this means: On a weekly base, realtor.com reports the year-over-year change in Active Inventory and New Listings. On a monthly basis, they report total inventory. For January, Realtor.com Reported Inventory was up 24.6% yoy, but still down 24.8% compared to the 2017 to 2019 Same Month Levels.
Realtor.com has monthly and weekly data on the existing home market. Here is their Weekly Report: Weekly Housing Trends View – data for week ending Feb. 8, 2025
• Active Inventory Increased, With For-Sale Homes 27.5% Above Year-Ago Levels
For the 66th conseecutive week, the number of homes for sale has increased compared with the same time last year. This week also marked the fifth straight week where the growth rate has increased, fueled by the entrance of many new listings on the market.
• NEW LISTINGS – A MEASURE OF SELLERS PUTING HOMES UP FOR SALE – INRUSED 11.3%
Fresh inventory increased year over year for the fifth week in a row, as cellers trickled back into the market. We Project Home Sales to Increase in 2025 Compared with 2024, which notched the Lowest Existing-Home Sales Since 1996.
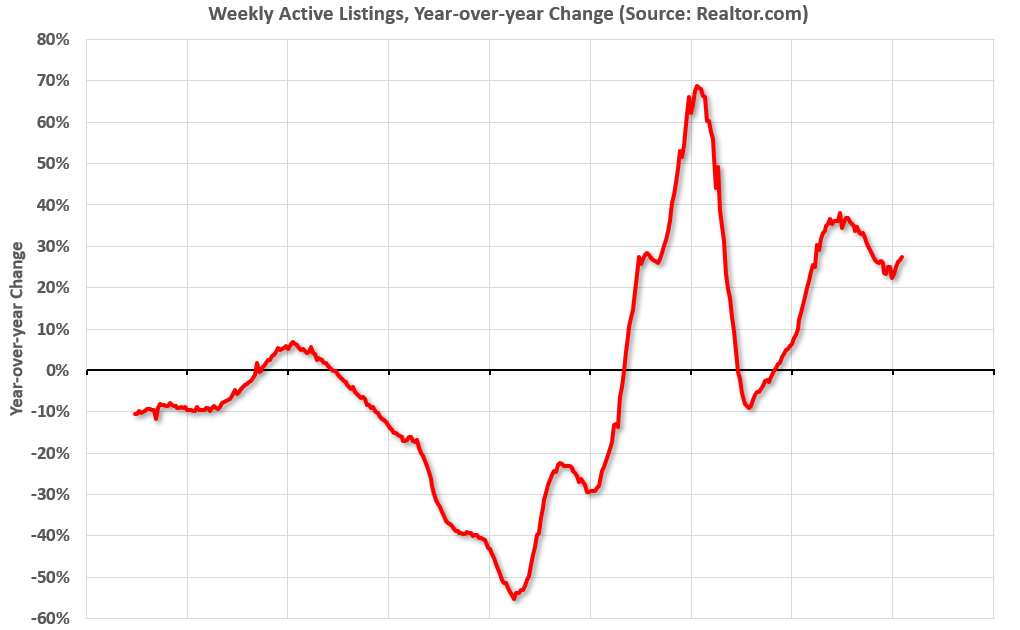
 Here is a graph of the year-over-year change in inventory according to realtor.com.
Inventory was Up Year-Over-Year for the 66th Consecutive week.
New Listings have jumped recently but remain below typical pre-pandemic levels.