

bee Calculated Risk On 2/16/2025 06:31:00 PM
The US Hotel Industry Reported Negative Year-Over-Year Comparisons, according to Costar’s Latest Data Through 8 February. …
2-8 February 2025 (Percentage Change from Comparable Week in 2024):
• Occupancy: 55.9% (-0.5%)
• Average Daily Rate (ADR): US $ 156.03 (-2.2%)
• Revenue by Available Room (Revpar): US $ 87.22 (-2.7%)
Emphasis added
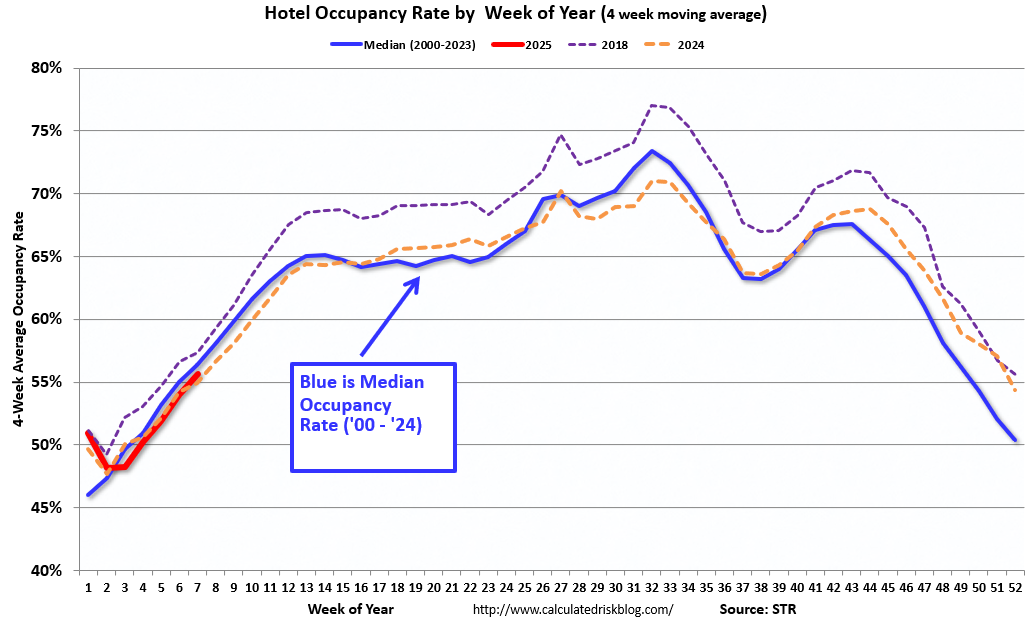
The following graph shows the seasonal pattern for the hotel occupancy rate using the Four-Week Average.
 Click on graph for larger image.
The red line is for 2025, blue is the median, and dashed light blue is for 2024. Dashed purple is for 2018, the record year for hotel occupancy.
The 4-Week Average of the Occupancy Rate is Tracking Last Year and is a Little Lower than the median rate for the period 2000 through 2024 (blue).
Note: Y-Axis does not start at zero to better show the seasonal change.
The 4-Week Average Will Increase Seasonally for the Next Couple of Months.