

bee Calculated Risk On 2/17/2025 08:11:00 AM
Altos Reports That Active Single-Family Inventory was up 0.9% week-over-week.
Inventory always declines seasonally in the winter and usually bottoms in January or February. Inventory is now up 2.2% from the bottom five weeks ago in January.
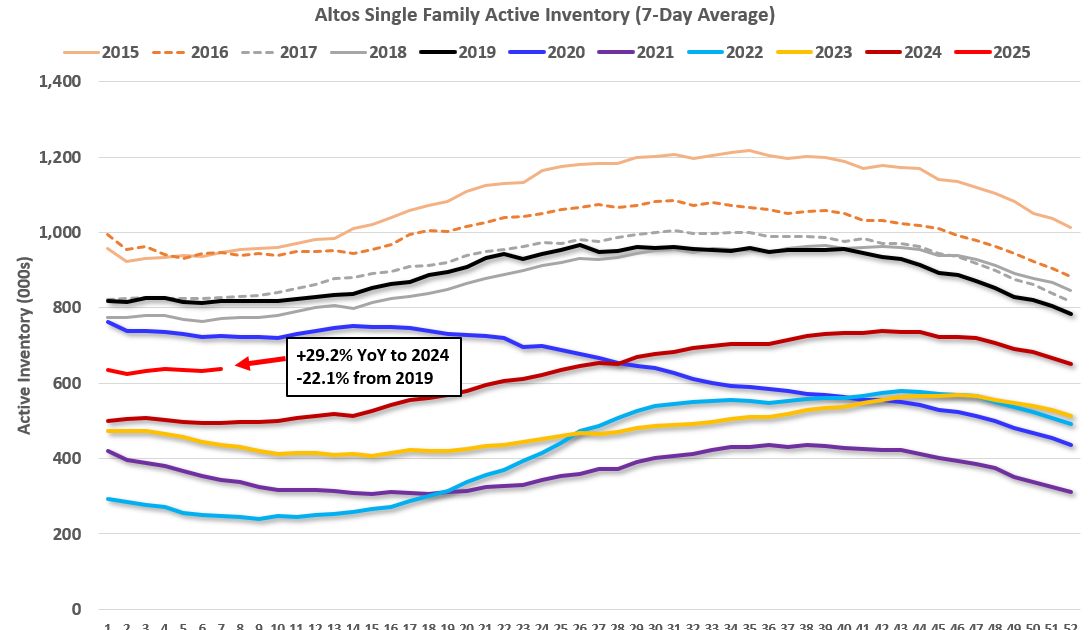
The first graph shows the seasonal pattern for Active Single-Family Inventory Since 2015.
 Click on graph for larger image.
The Red Line is for 2024. The Black Line is for 2019.
Inventory was up 29.2% Compared to the same week in 2024 (Last week it was up 27.8%), and down 22.1% compared to the same week in 2019 (Last week it was down 22.1%).
Back in June 2023, Inventory was Down Almost 54% Compared to 2019, so The gap to more normal inventory levels has closed significantly!
 This Second Inventory Graph is Courtesy of Altos Research.
If or Feb 14th, Inventory was at 638 thousand (7-day average), compared to 632 thousand the prior week.