

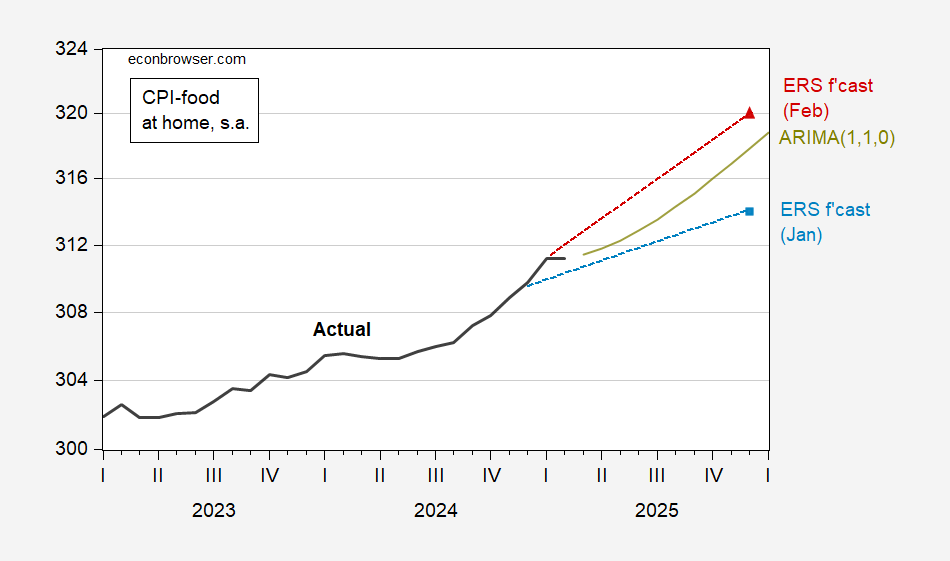
From the CPI Release, Food at Home (AKA Grocery) Prices:

Figure 1: CPI Food at Home Component (Bold Black), ers January Forecast (Blue Square), ers February forecast (Red Triangle), Arima (1,1,0) forecast 2021m01-2025m02 (Chartreuse Line), All SA source: pages, and Author's Calculations.
This made me wonder how prices for “ordinary folk” are doing in general. We know the CPI is “Plutocratic” representing expenditure weights of the household at about the 67th percent. I show food-at-home and shelter components of the CPI, as well as the American Institute for Economic Research's (Aier) “Everyday Price Index”, or Epi, all normalized in logs to 2024m11 = 0.
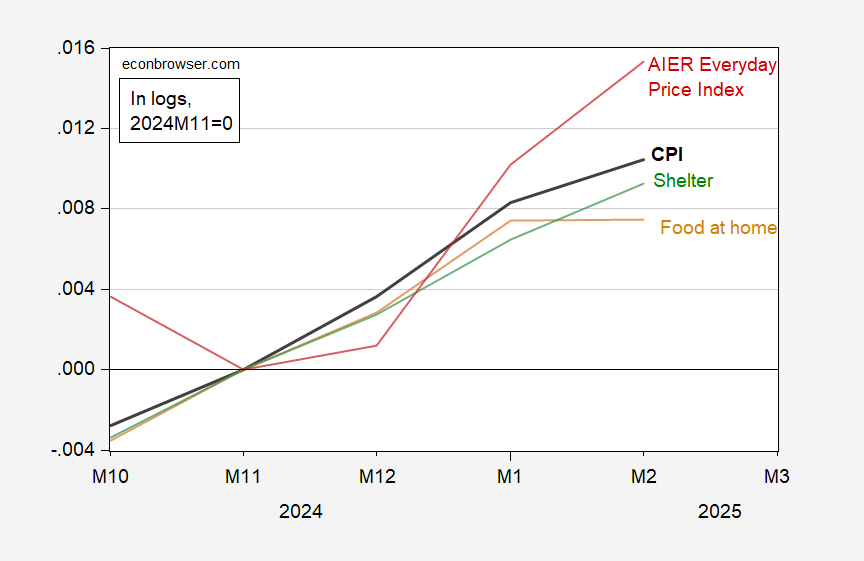
Figure 2: CPI-all Urban (Bold Black), CPI Food-At-Home (Tan), CPI Shelter (Green), Aier Everyday Price Index (ed), all in logs 2024m11 = 0. Source: BLS, AIER, AND AUTHOR'S CALCULATIONS.