


Expectations in March (Prel.) At 54.2 vs. 64.3 Bloomberg Consensus. Thanks, drumpf.
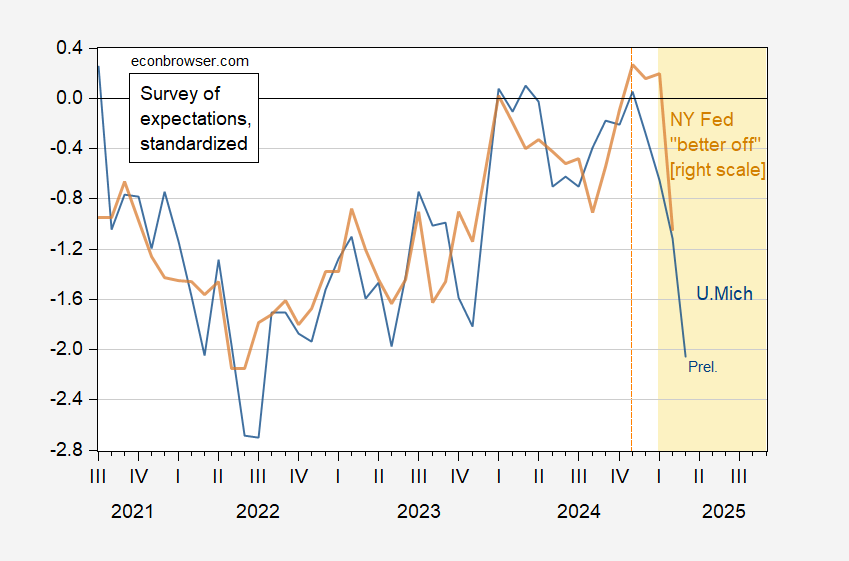
Figure 1: U.Michigan Expectations Index (Blue), and NY “Better Off” Aggregate (Tan), Both Demeaned and Standardized (2013m06-2025m02). Source: U.Michigan, NY Fed, and Author's Calculations.