


Uncertainty from text analysis, and from consumer surveys:
First Economic Policy Uncertainty:
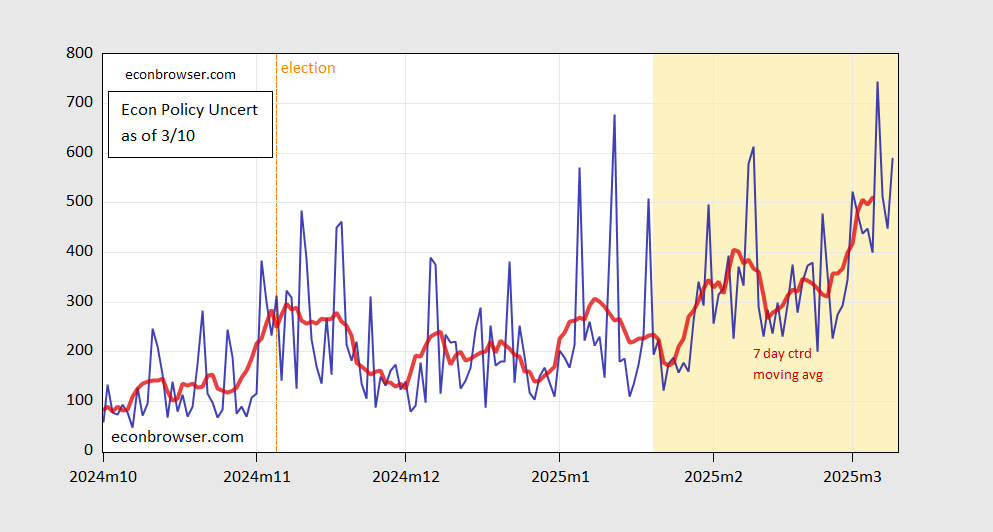
Figure 1: EPU (Blue), and 7 Day Centered Moving Average (Red). Source: policyuncertainty.com and author's calculations.
Next, considered the newly released ny fed measures of 1 year ahead expected inflation, and uncertainty.
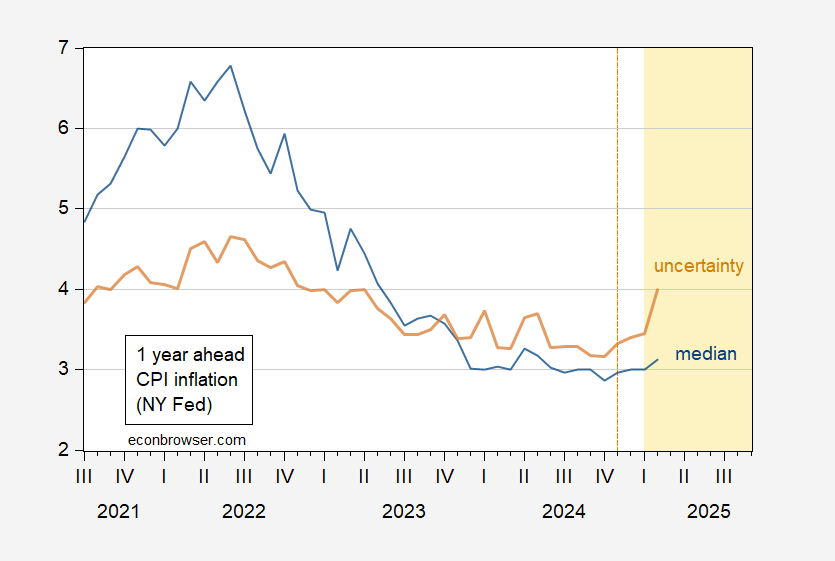
Figure 2: Median One Year Ahead Inflation (Blue), and Associated Uncertainty (Brown). Source: NY Fed.
Third, even more interesting is how the “better off” a year ahead number (sum of much better off and somewhat better off) has evolved, vs. U.Michigan Economic Sentiment and Conference Board Confidence.
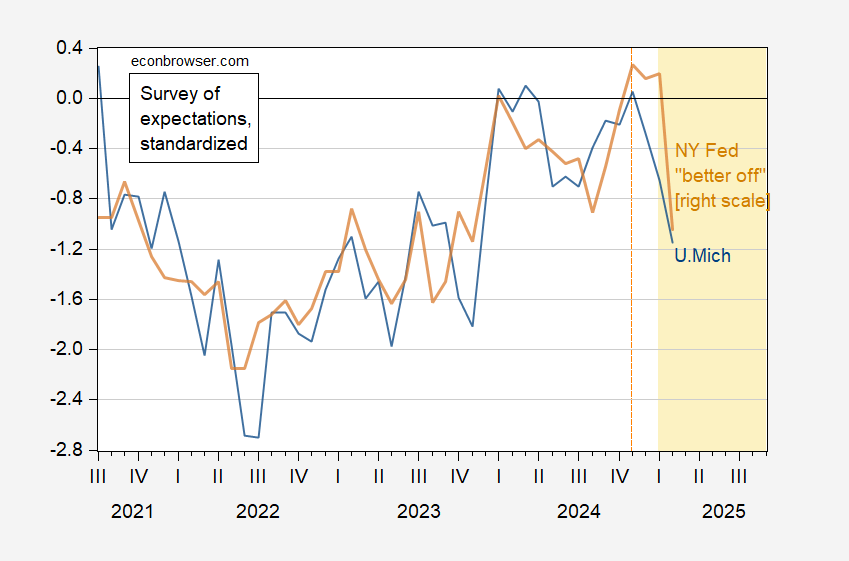
Figure 3: U. Michigan Survey Median Future Expectations (Blue, Left Scale), and NY Fed Survey “Better Off in a Year” (Brown, Right Scale), Both demeaned and divided by Standard Deviation 2013-2025. Source: U.Mich. via Fred, NY Fed, and Author's Calculations.