

bee Calculated Risk On 3/10/2025 10:36:00 AM
Today, in the calculated Risk Real Estate Newsletter: Part 1: Current State of the Housing Market; OVERVIEW FOR MID-MARCH 2025
A letter excerpt:
This 2-Part overview for mid-march provides a snapshot of the current housing market.
Inventory, Inventory, Inventory! Inventory usually tells the tale. Currently I'm watching months-of-supply closely.
…
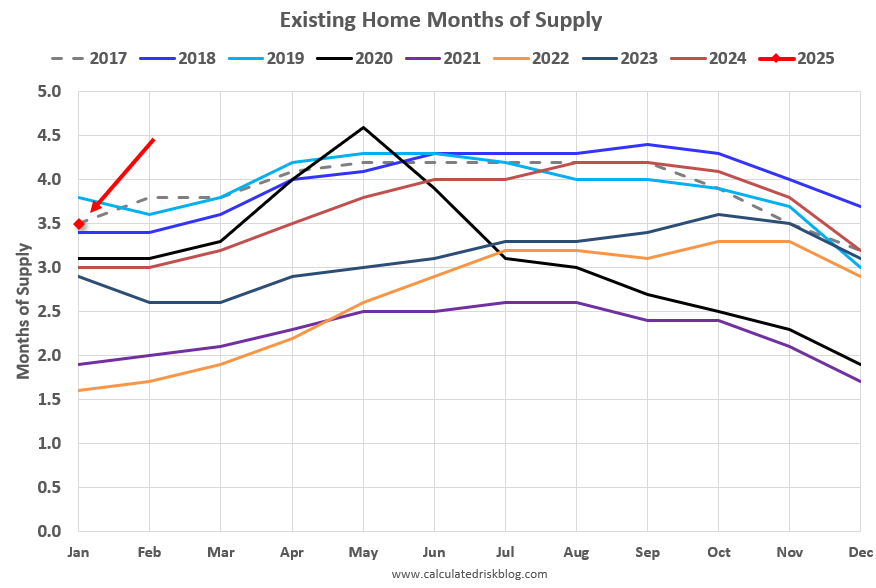
Since Both Inventory and Sales have fallen significantly, a key for house prices is to watch months-of-supply. The following graph shows months-of-Supply Since 2017. The following graph shows months-of-Supply Since 2017. Note that months-of-supply is higher than 6 of the last 8 years, and at the same level as in 2017.
Months-of-Supply was at 3.5 months in January 2025, up from 3.0 months in January 2024, and down from 3.8 months in January 2019. Note that december and January usually have the lowest months-or-Supply.
This suggests that year-over-Year price growth will continue to slow. Inventory would probably have to increase 5 1/2 to 6 months of supply to see national price declines again.
There is much more in the article.