
A Big Jump:
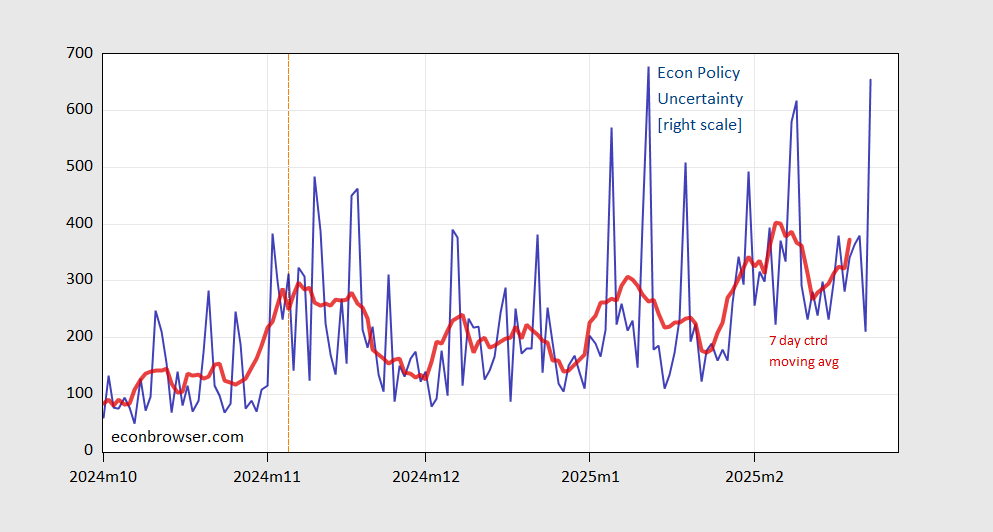
Figure 1: EPU (Blue), 7 Day Centered Moving Average (Red). Dashed orange line at election. Source: policyuncertainty.com via Fred.
Yesterday’s Move Puts the Epu at 3.5 Standard Deviations Above the Mean 10/1/2024-2/23/2025.


A Big Jump:
Figure 1: EPU (Blue), 7 Day Centered Moving Average (Red). Dashed orange line at election. Source: policyuncertainty.com via Fred.
Yesterday’s Move Puts the Epu at 3.5 Standard Deviations Above the Mean 10/1/2024-2/23/2025.