

bee Calculated Risk On 3/11/2025 11:52:00 AM
Today, in the Calculated Risk Real Estate Newsletter: 2nd Look at Local Housing Markets in February
A letter excerpt:
Note: The Tables for Active Listings, New Listings and Closed Sales All Include a Comparison to February 2019 for Each Local Market (Some 2019 data is not available).
This is the second look at Several Early Reporting Local Markets in February. I'm tracking over 40 Local housing markets in the US. Some of the 40 markets are states, and some are metropolitan areas. I'm update these tables throughout the month as additional data is released.
Closed sales in February were mostly for contracts signed in December and January when 30-year mortgage rates averaged 6.72% and 6.96%, respectively (Freddie Mac PMMS). This was an increase from the average rate for homes that closed in January, and up slightly from the average rate of 6.7% in December 2023 and January 2024.
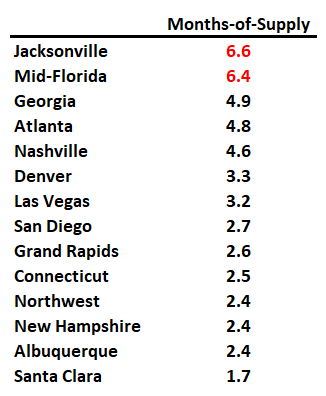
…Here is a look at months-of-supply using NSA sales. Since this is NSA data, it is likely months-of-supply will increase in the summer.
Months in Red are areas that are seeing 6 months of supply now and will likely see price pressures.
…
This was just Several Early Reporting Markets. Many more local markets to come!
There is much more in the article.